DebugKit Documentation
DebugKit adds a debugging toolbar to CakePHP 2 applications. This plugin is a fork of cakephp/debug_kit for pieceofcake2/cakephp.
- Installation
- The Toolbar
- Toolbar Panels
- Configuration
- Request History Storage
- Developing Your Own Panels
- Cache Engine
- Upgrading from 2.2.x
- Credits
- Toolbar Screenshots (2.3.x)
- Toolbar Screenshots (2.2.x)
Installation
Install the plugin with Composer:
composer require --dev pieceofcake2/debug_kitThe plugin has the cakephp-plugin type, so it is installed into your plugins directory by composer/installers. Set installer-paths in your application's composer.json so it is installed into the right place:
| Layout | installer-paths |
|---|---|
Modern (config/, src/, templates/, plugins/) | "plugins/{$name}/": ["type:cakephp-plugin"] |
Legacy (app/Config/, app/Plugin/) | "app/Plugin/{$name}/": ["type:cakephp-plugin"] |
Enable the plugin
Load the plugin in config/bootstrap.php (legacy layout: app/Config/bootstrap.php). If you already use CakePlugin::loadAll(), this is not necessary:
CakePlugin::load('DebugKit');Add the toolbar component to src/Controller/AppController.php (legacy layout: app/Controller/AppController.php):
class AppController extends Controller
{
    public $components = ['DebugKit.Toolbar'];
}The toolbar is shown when debug is 1 or higher in config/core.php.
Remove the sql_dump element from your layout (usually templates/Layouts/default.ctp, legacy layout: app/View/Layouts/default.ctp). The element empties the query log before the Sql Log panel reads it, so the panel would show "No query logs".
The Toolbar
Since 2.3.0 the toolbar has the look and the architecture of DebugKit 5 (cakephp/debug_kit 5.x), adapted to CakePHP 2:
- A small CakePHP icon is shown in the bottom right-hand corner of HTML pages. Clicking it opens the toolbar with one button per panel along the bottom of the page. Clicking a button slides the panel content up. Esc closes the panel or the toolbar, the arrow keys switch between panels.
- The toolbar is rendered inside an iframe, so the CSS and JavaScript of your application cannot break the toolbar, and the toolbar cannot break your application.
- At the end of each request (
ToolbarComponent::shutdown(), orbeforeRedirect()for redirects) the panels are rendered and saved in the request history storage, and a small loader script (webroot/js/inject-iframe.js) is inserted before</body>. The toolbar (/debug_kit/requests/view/<id>) and each panel (/debug_kit/panels/view/<id>/<panel>) are then loaded with separate requests to the plugin's controllers. - Every recorded response has an
X-DEBUGKIT-IDheader. Ajax requests made by the page (XMLHttpRequestandfetch()) are listed in the History panel, and selecting any request in the History panel shows its panels in the toolbar. - The toolbar is only inserted into HTML responses. JSON, XML, ajax,
requestAction()and redirect responses are recorded (so they can be inspected from the History panel) but are left untouched. Requests to the DebugKit plugin itself are not recorded.
The plugin controllers rely on the default plugin routes (/:plugin/:controller/:action/*), which are loaded by require CAKE . 'Config' . DS . 'routes.php'; in your routes.php.
Toolbar Panels
The toolbar is made up of several panels, which are shown by clicking the CakePHP icon in the bottom right-hand corner of the page. Each panel consists of a panel class and a view element. Typically a panel collects and displays a single type of information, such as logs or request information. You can choose which panels are shown and add your own.
Built-in Panels
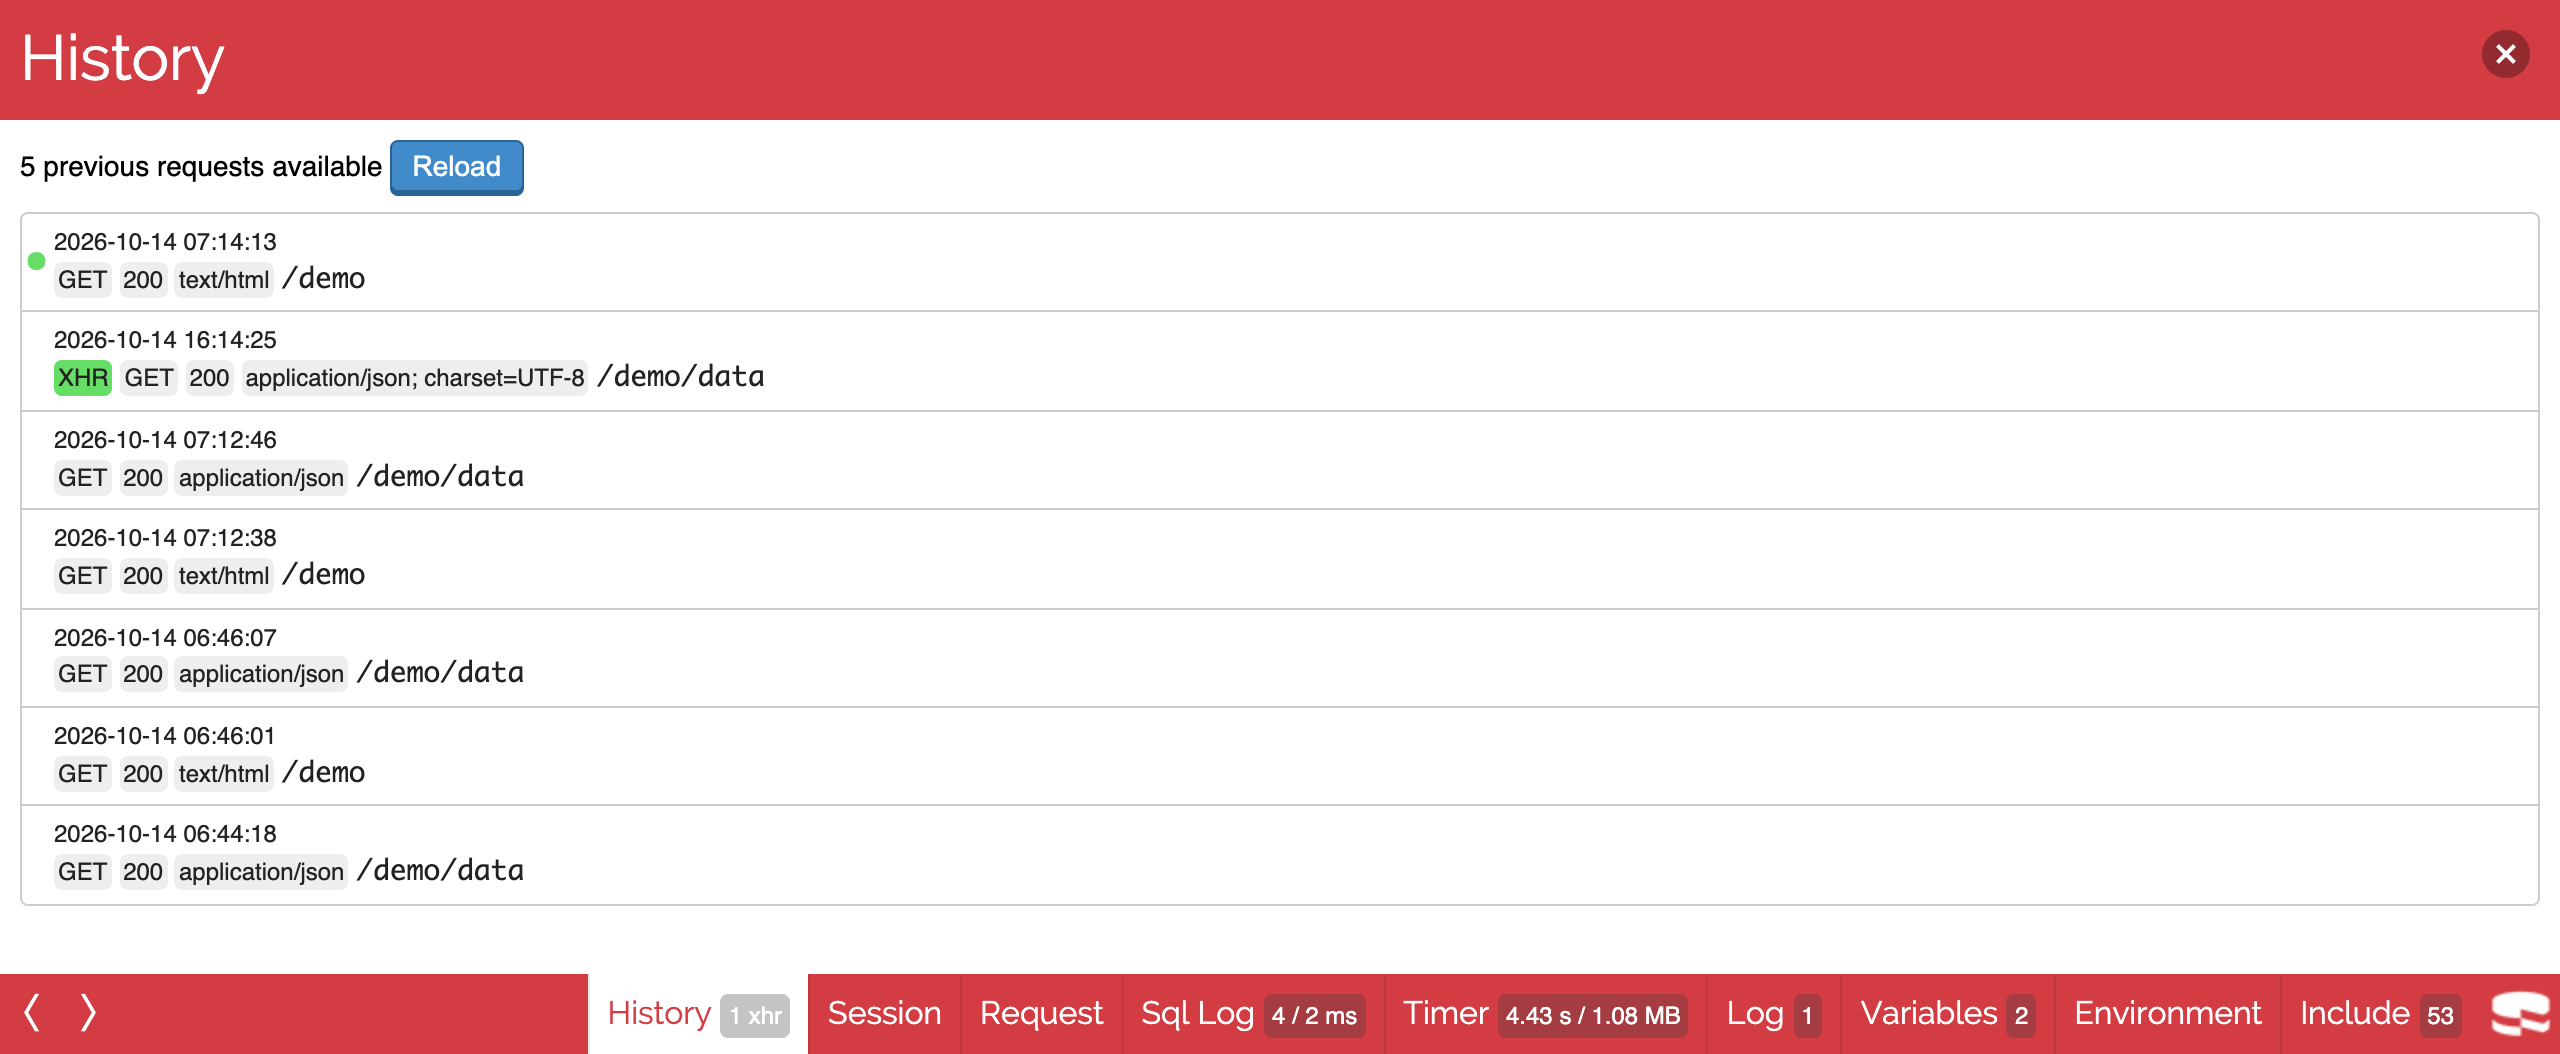
- History: Lists the previous requests (including redirects and ajax requests) and shows their panels in the toolbar, useful when debugging actions with redirects.
- Session: Displays the information currently in the session.
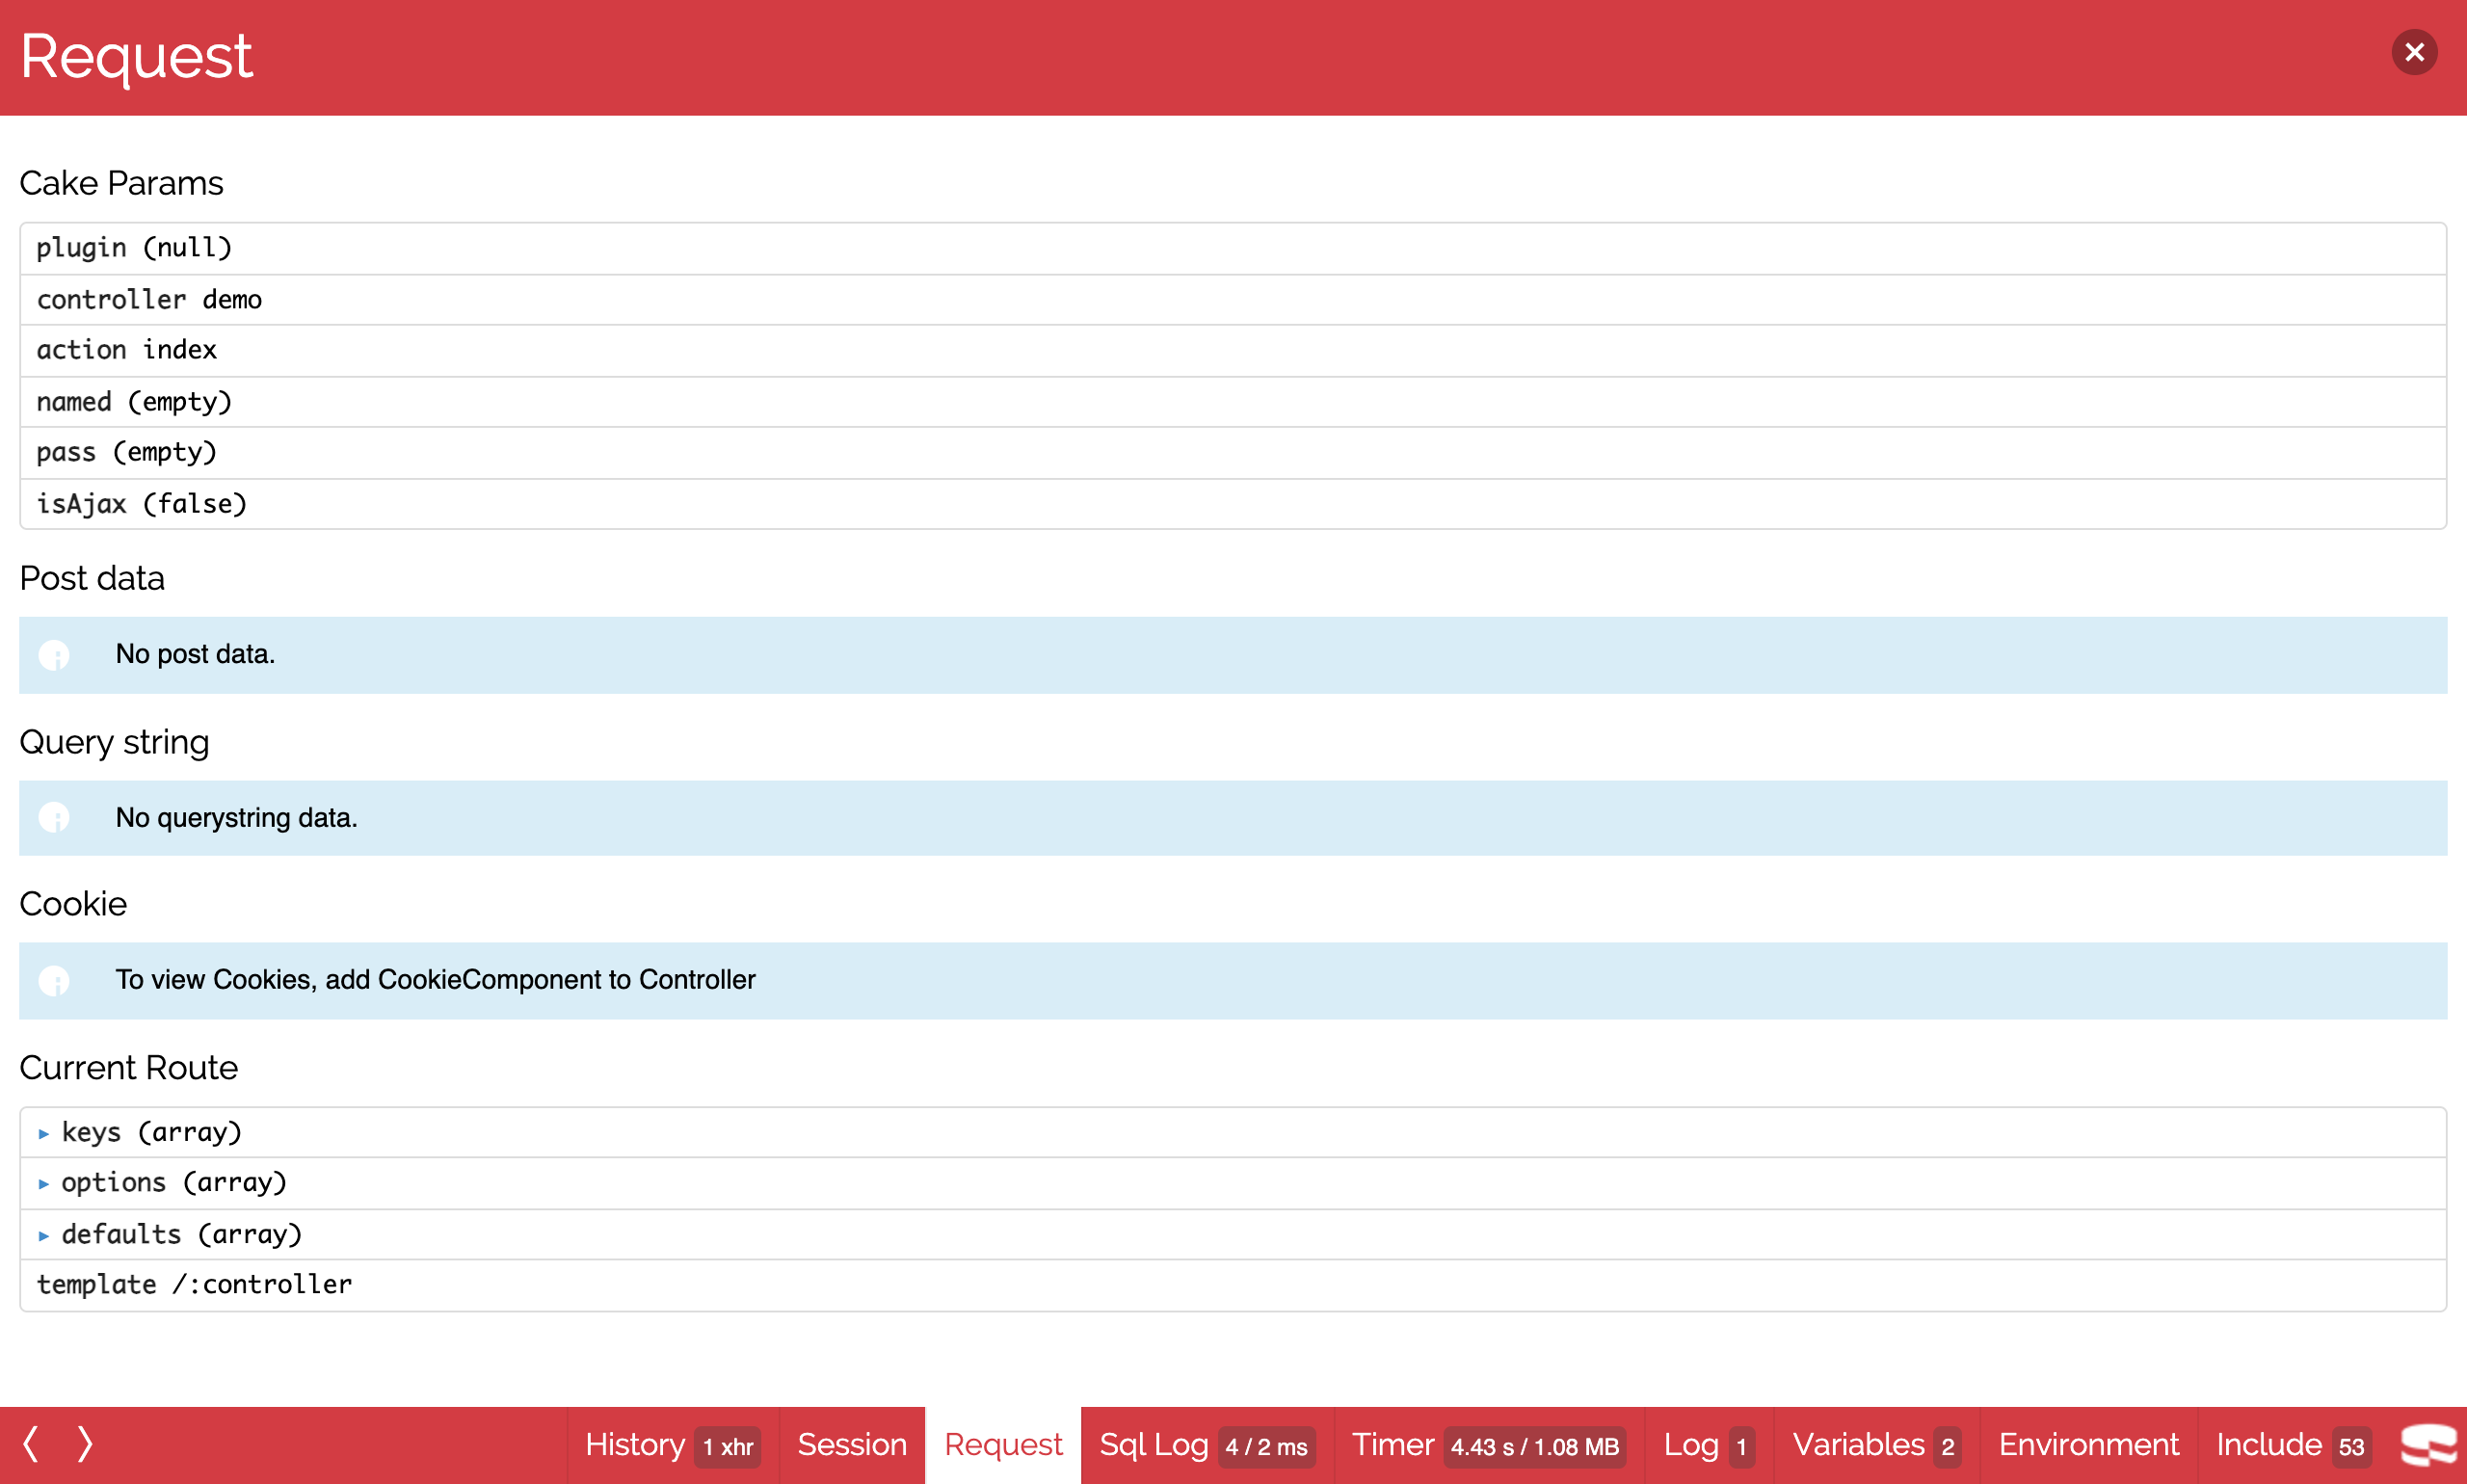
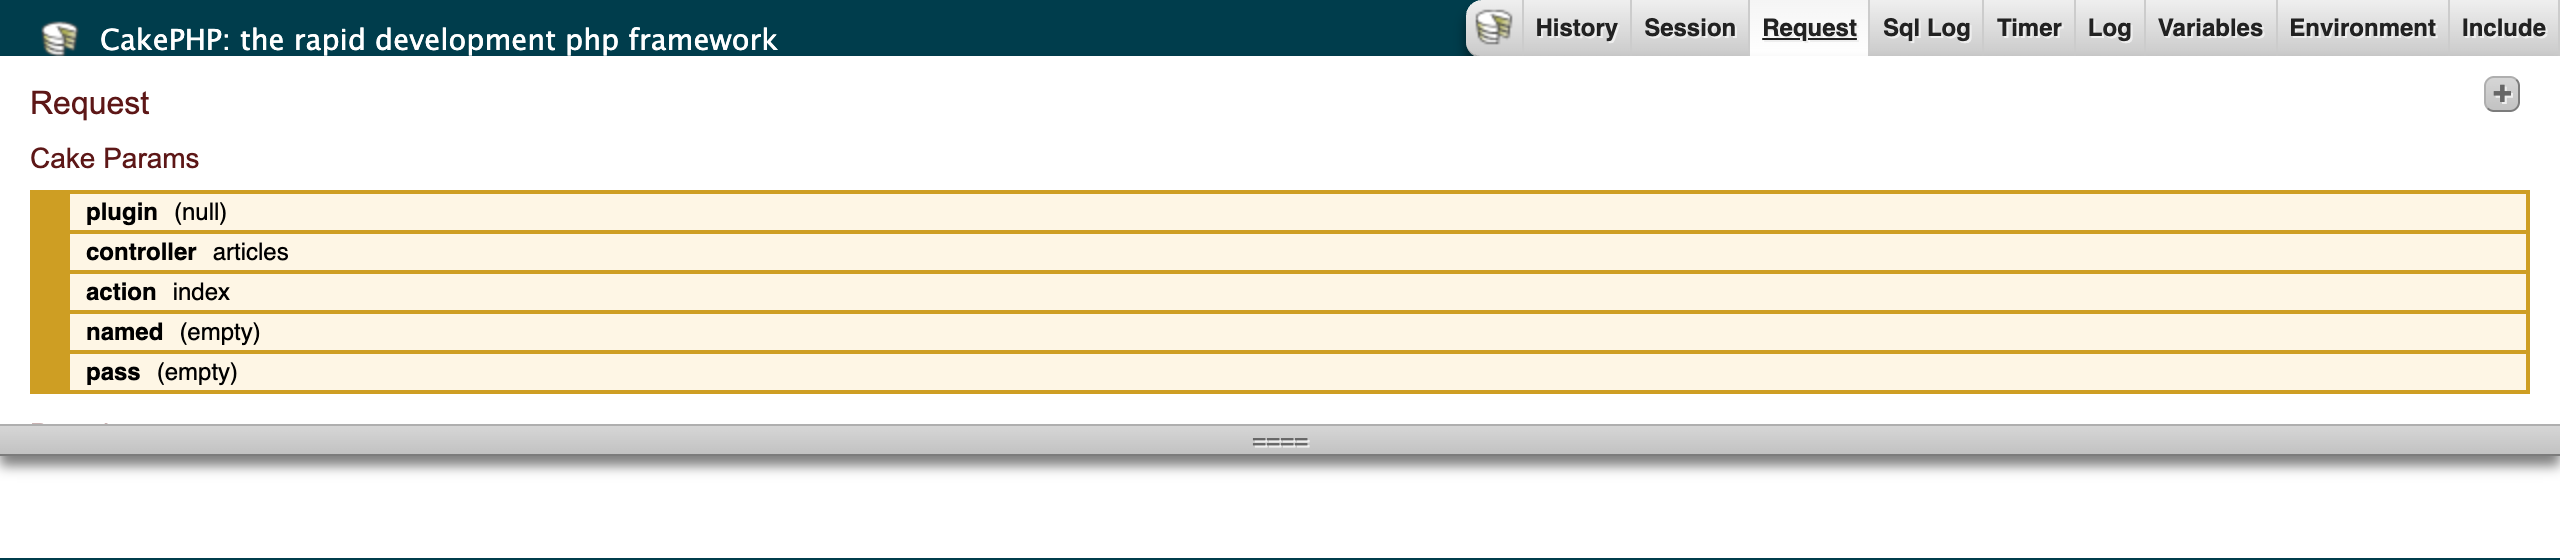
- Request: Displays information about the current request: GET, POST, Cake parameters, current route information, and cookies if
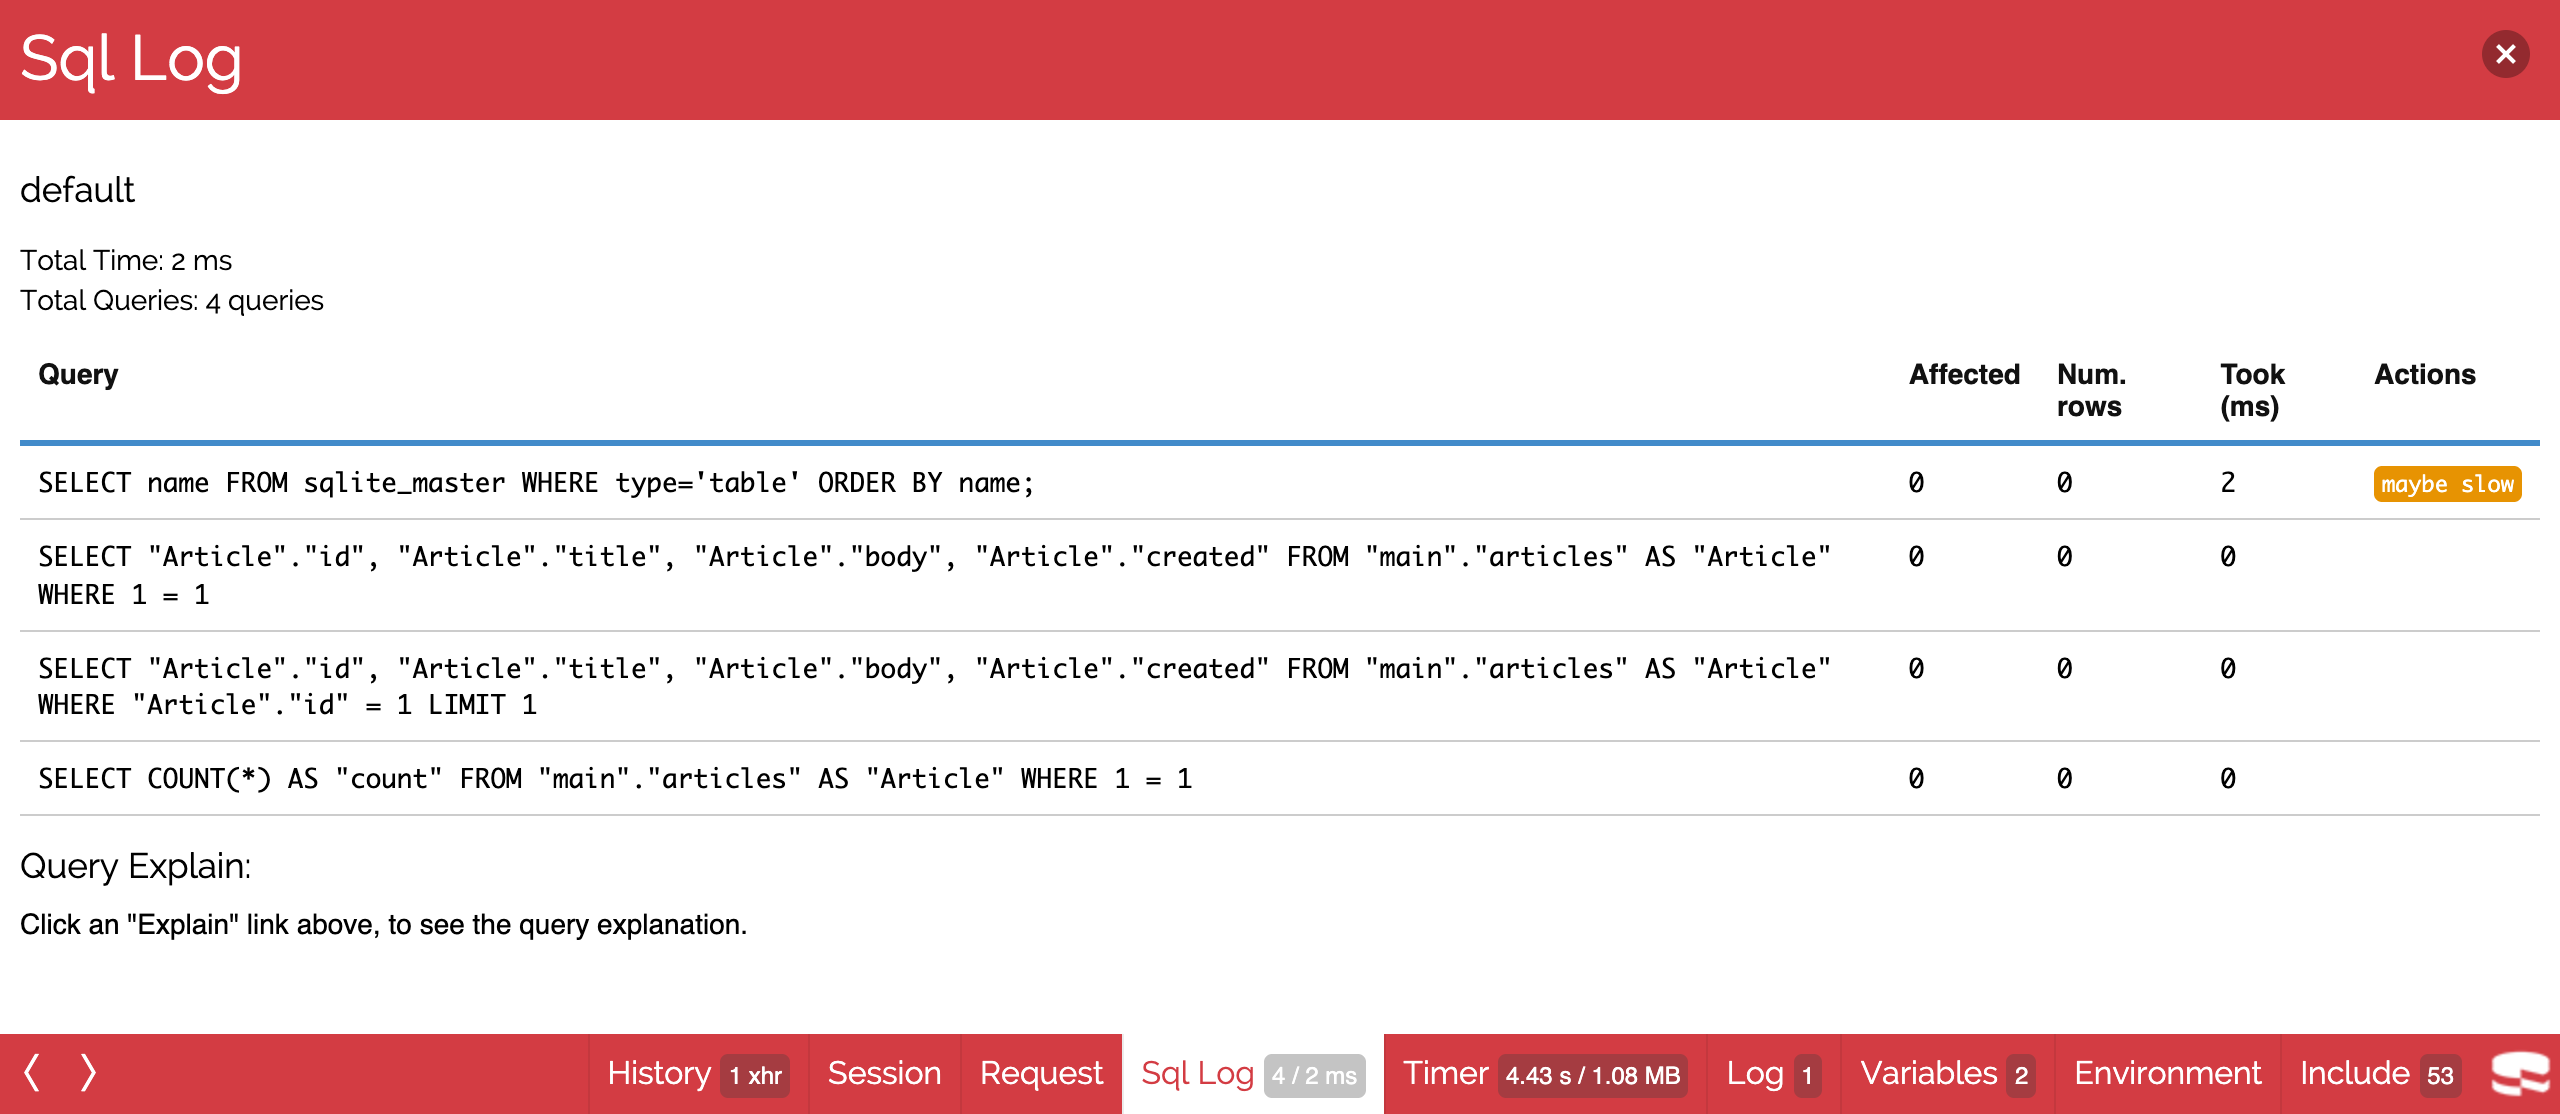
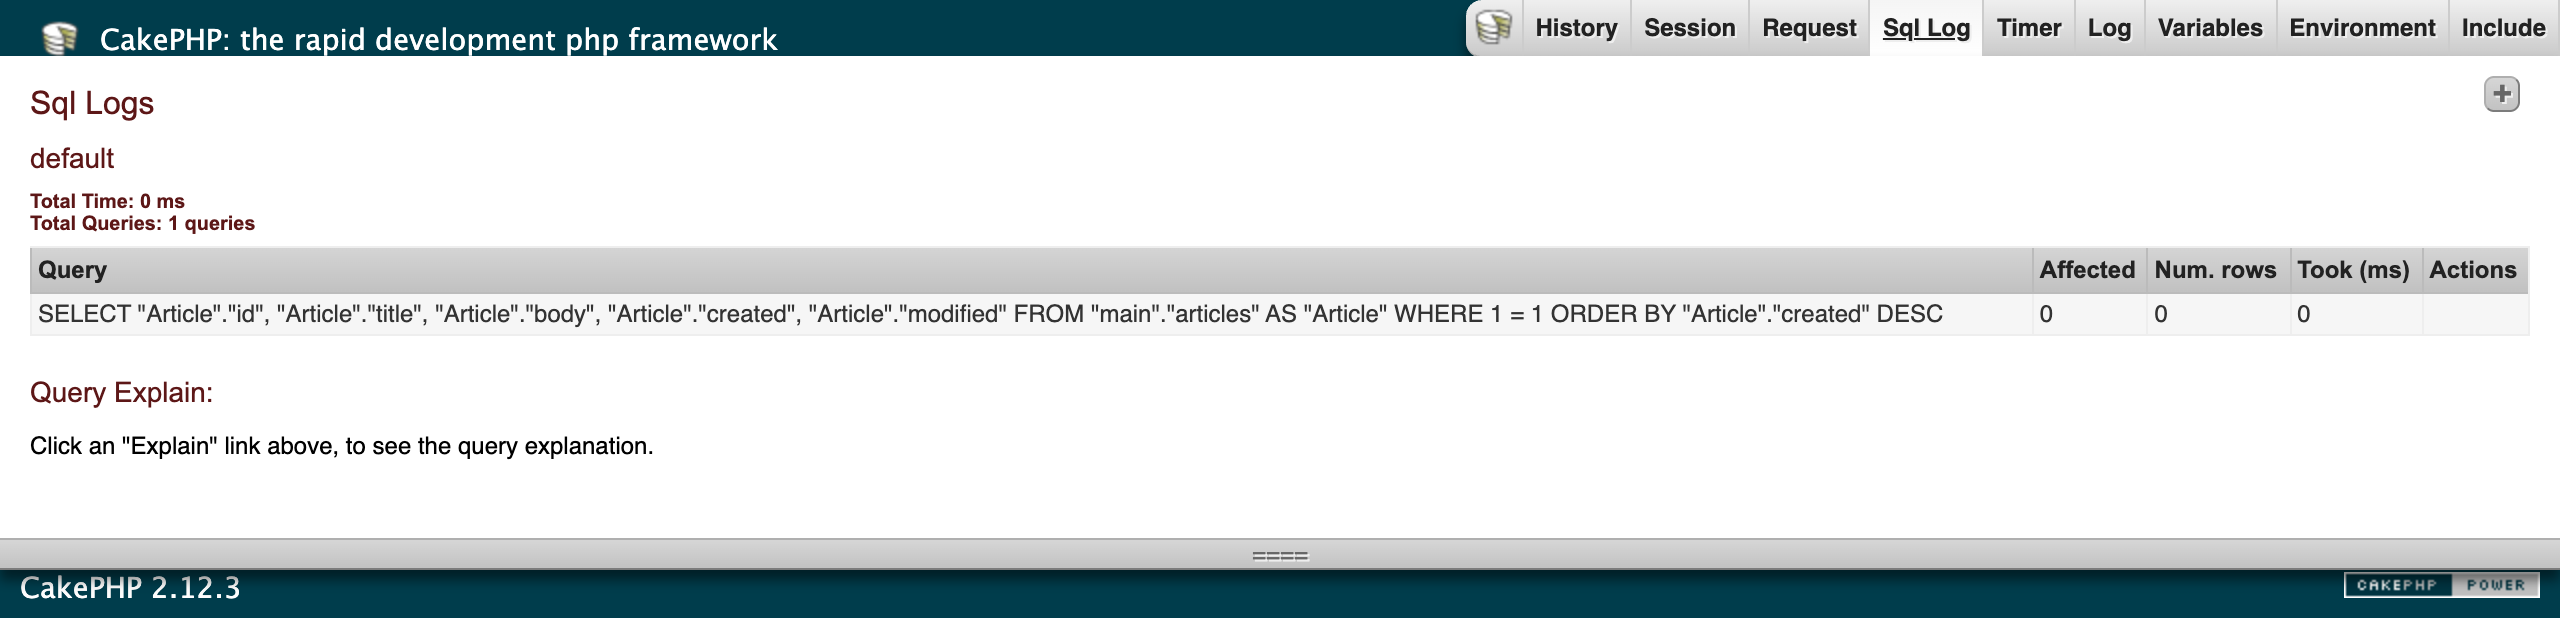
CookieComponentis in your controller's components. - Sql Log: Displays the SQL log for each database connection.
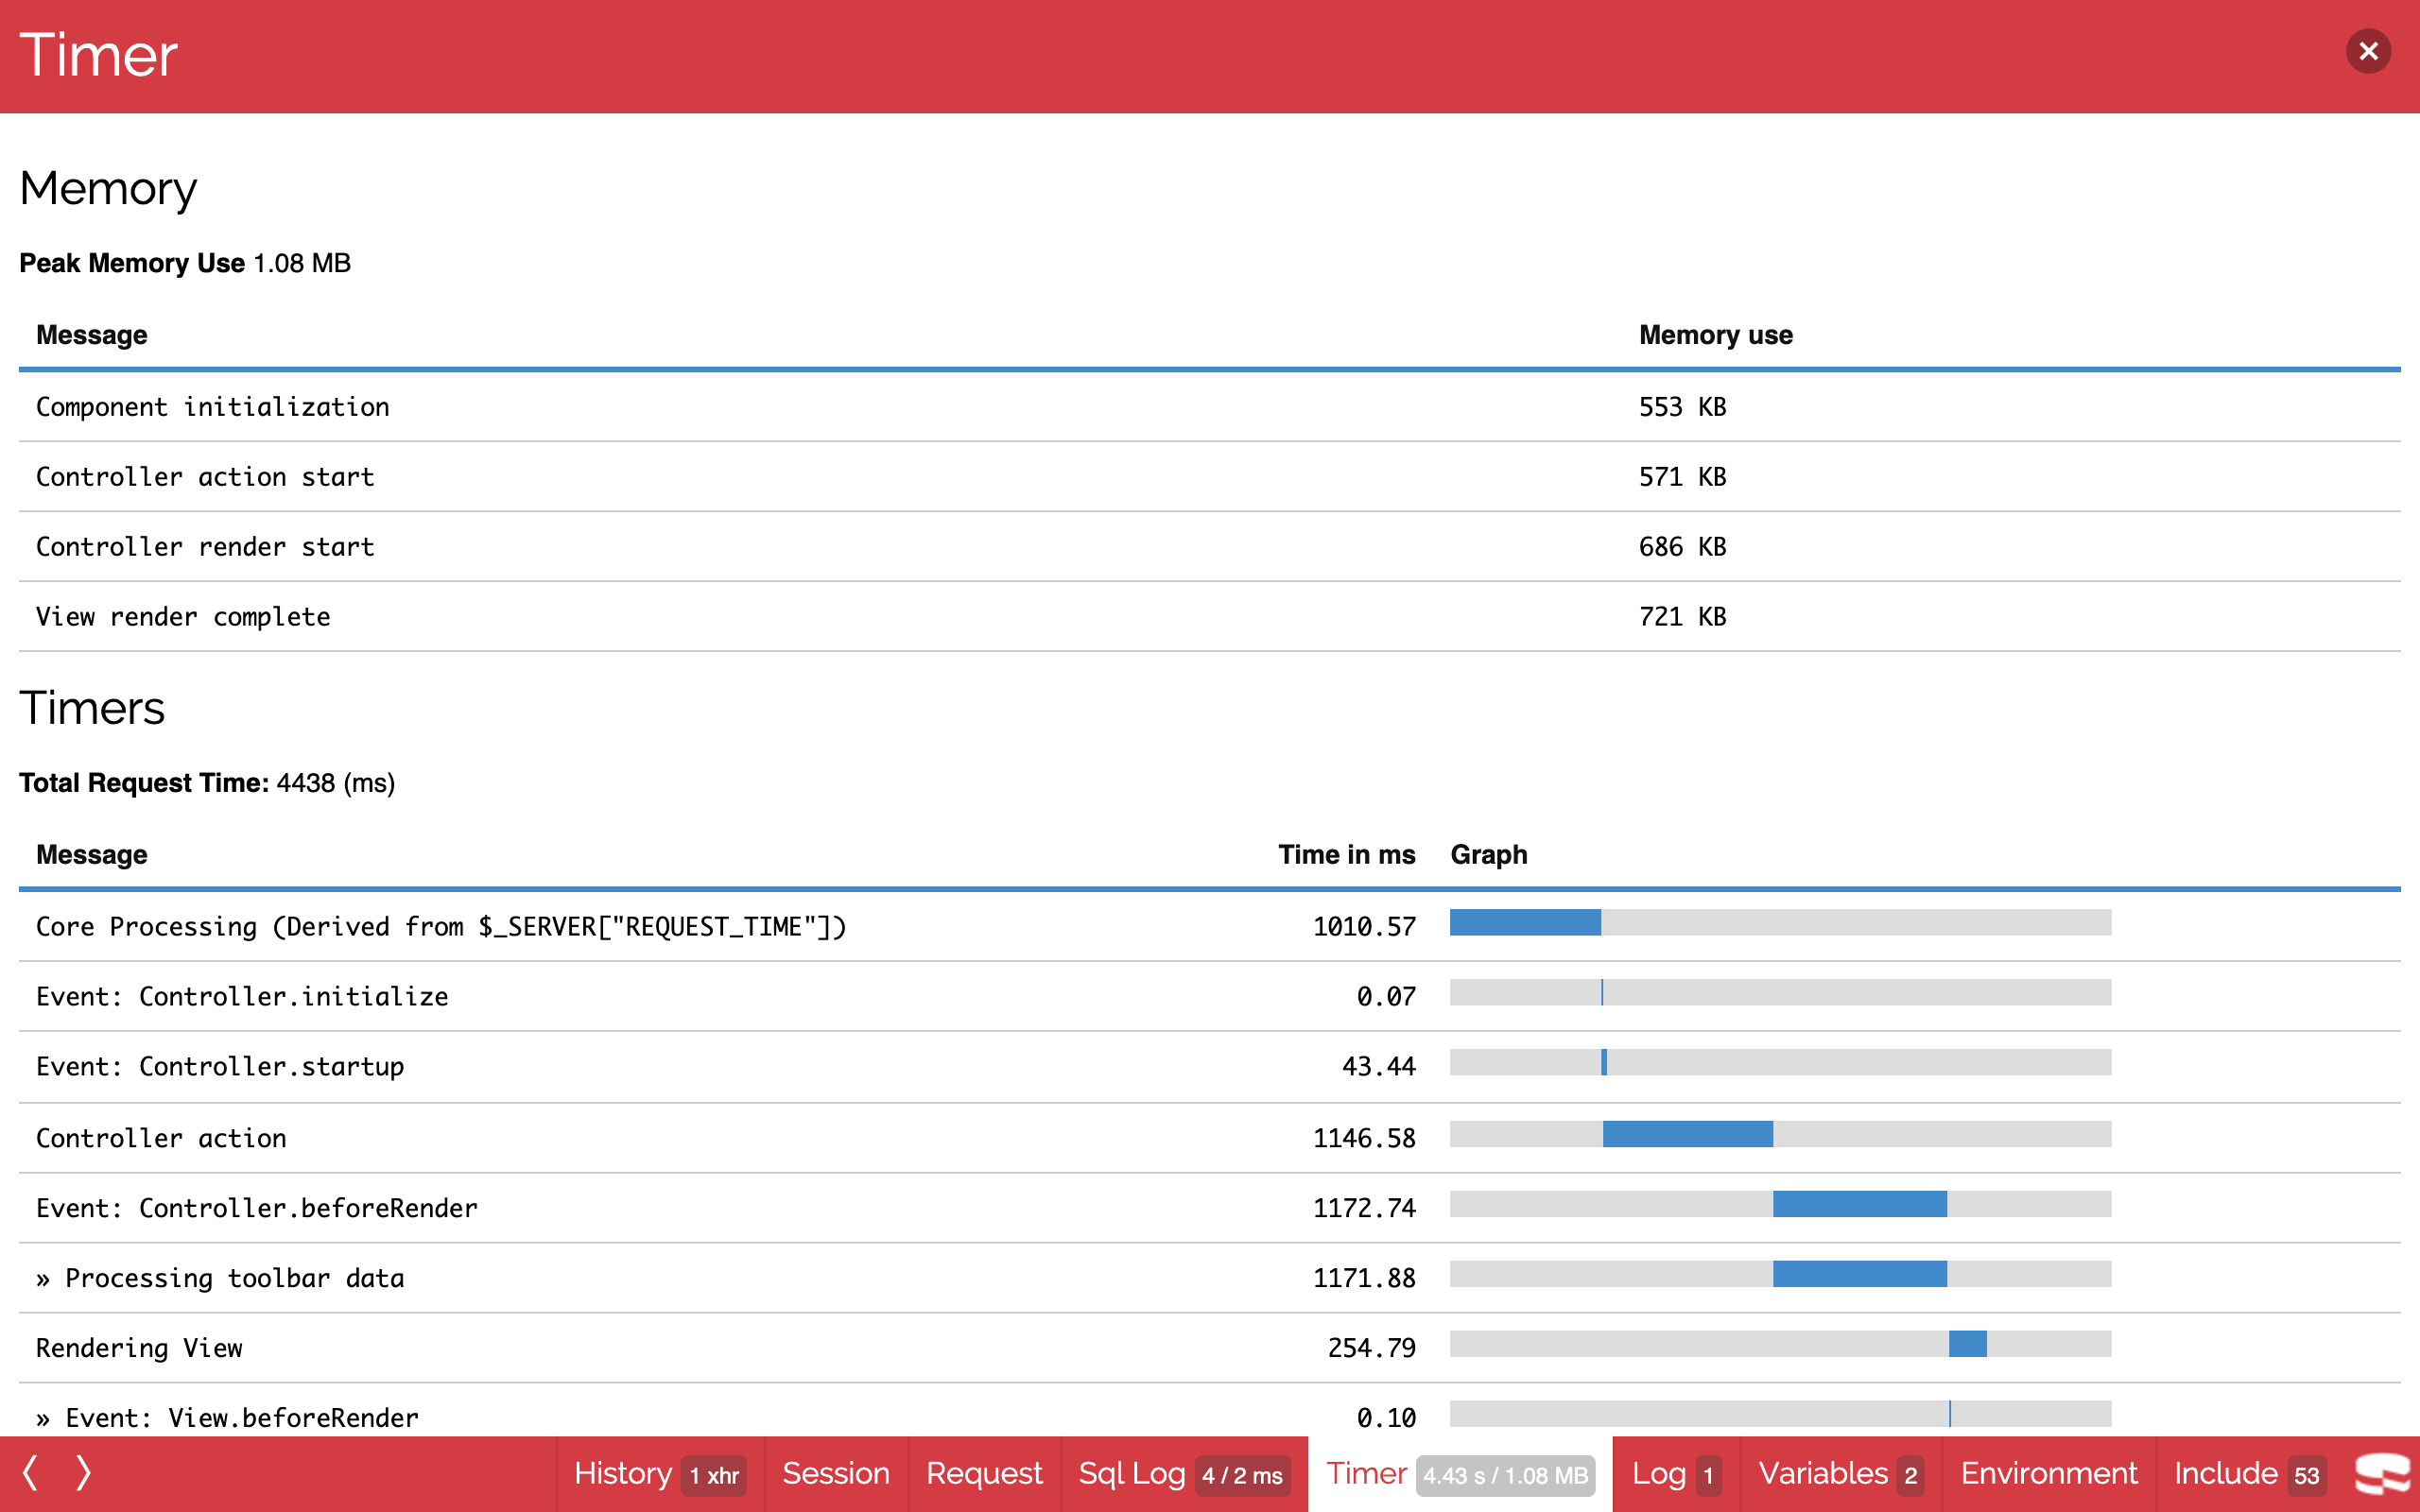
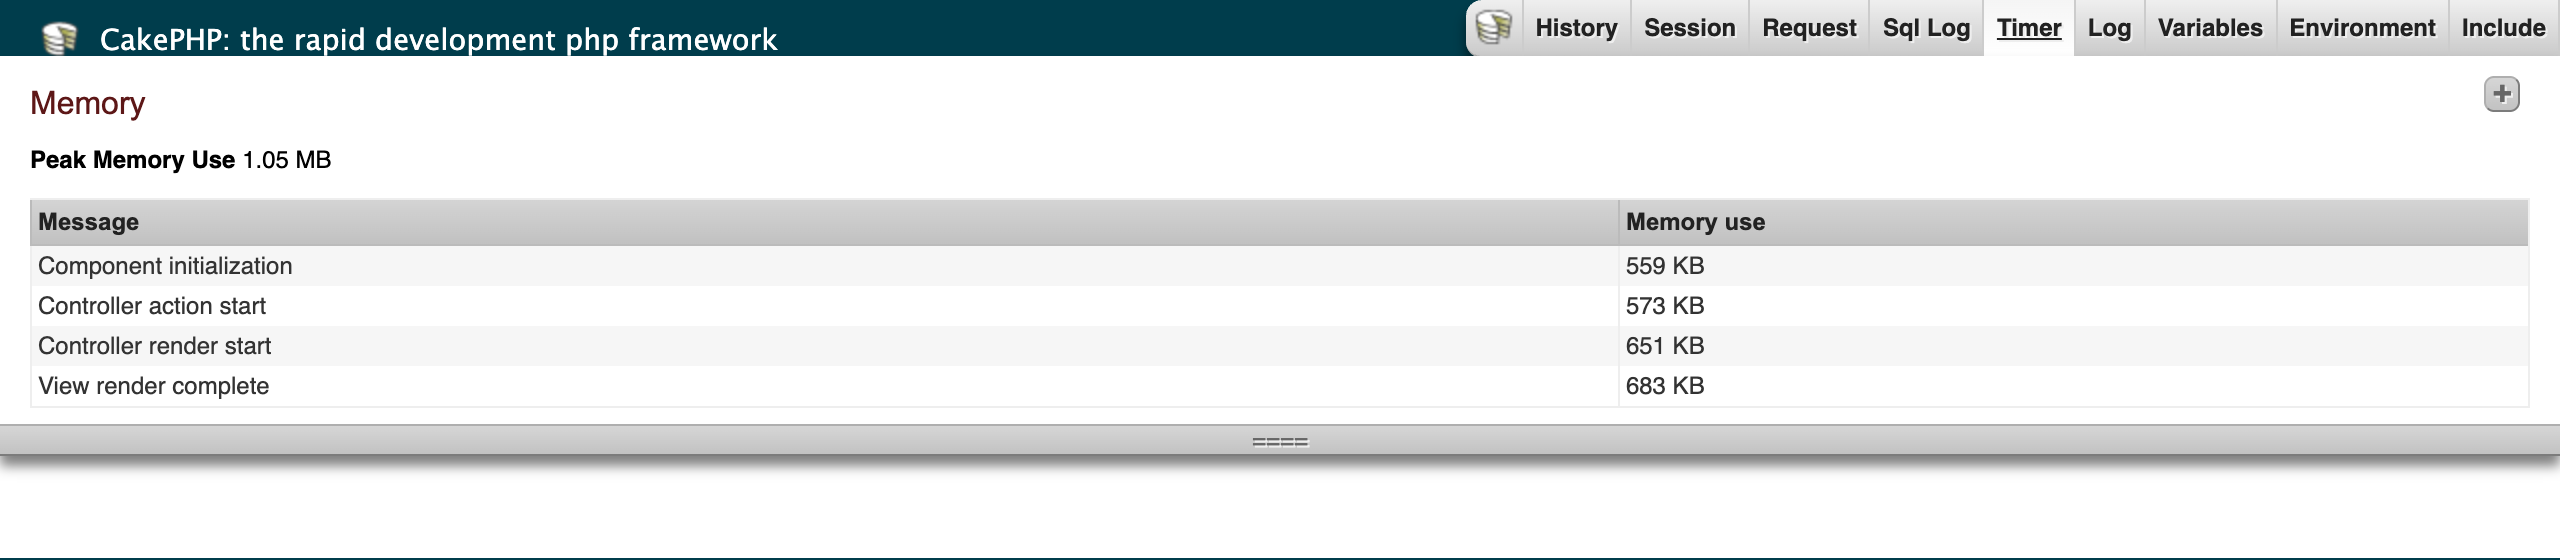
- Timer: Displays any timers that were set during the request (see
DebugKitDebugger), the memory used at component callbacks, and the peak memory use. - Log: Displays the log entries written during the request.
- Variables: Displays the view variables set in the controller.
- Environment: Displays environment variables related to PHP and CakePHP.
- Include: Displays the included files, grouped by type.
Configuration
Settings are passed in the component declaration like any other component settings:
public $components = [
    'DebugKit.Toolbar' => [/* settings */],
];Controlling Panels
The panels key sets which panels are loaded and in which order:
public $components = [
    'DebugKit.Toolbar' => ['panels' => ['MyCustom', 'timer' => false]],
];This adds your custom panel MyCustomPanel and removes the built-in Timer panel.
Other keys are passed to the panels' constructors. For example, the built-in History panel uses the history key to set the number of past requests it lists:
public $components = [
    'DebugKit.Toolbar' => ['history' => 10],
];The panels key itself is not passed to the panel constructors.
forceEnable
forceEnable shows the toolbar regardless of Configure::read('debug'). This is useful when profiling an application in production mode:
public $components = [
    'DebugKit.Toolbar' => ['forceEnable' => true],
];autoRun
autoRun controls whether the toolbar runs automatically. Set it to false to enable the toolbar only when the URL has the ?debug=true query string:
public $components = [
    'DebugKit.Toolbar' => ['autoRun' => false],
];forceEnable without debug mode
The toolbar endpoints (/debug_kit/requests/..., /debug_kit/panels/...) are only available in debug mode. To use forceEnable with debug set to 0, also write the setting to Configure so that the endpoints are enabled:
Configure::write('DebugKit.forceEnable', true);Request History Storage
The recorded requests and their rendered panels are stored in a SQLite database, TMP/debug_kit.sqlite (usually tmp/debug_kit.sqlite). The debug_kit connection is created with ConnectionManager::create() and the tables are created automatically. Only the latest 20 requests are kept.
When the PDO SQLite driver is not available (or the database cannot be created), the requests are stored in the debug_kit cache configuration instead (see Cache Engine). When neither is available, the request is not recorded and the toolbar is not shown.
| Setting | Default | Description |
|---|---|---|
requestCount | 20 | Number of requests to keep. |
storage | auto | auto uses the database and falls back to the cache, database or cache force one of them. |
connection | debug_kit | Connection name. If your database.php defines a connection with this name, it is used (and the tables are created in it) instead of the SQLite file. On MySQL, the panel content column is created as LONGTEXT, because TEXT holds at most 64 KB. |
database | TMP . 'debug_kit.sqlite' | SQLite file used when the connection is created. |
The toolbar endpoints only read Configure::read('DebugKit'), so put storage settings there (the component reads it too) rather than in the component settings:
Configure::write('DebugKit', [
    'requestCount' => 50,
    'database' => TMP . 'debug_kit' . DS . 'requests.sqlite',
]);Developing Your Own Panels
Panel Classes
Panel classes are placed in the Panel directory inside a Lib path. The file name must match the class name, so MyCustomPanel is expected in src/Lib/Panel/MyCustomPanel.php (legacy layout: app/Lib/Panel/MyCustomPanel.php). Panels must extend DebugPanel:
App::uses('DebugPanel', 'DebugKit.Lib');

class MyCustomPanel extends DebugPanel
{
}See also the example panel in tests/test_app/Plugin/DebugkitTestPlugin/Lib/Panel/PluginTestPanel.php.
Panels can define the css and javascript properties (arrays) to include additional CSS or JavaScript in the toolbar. They are loaded into the toolbar iframe, not into your page:
class MyCustomPanel extends DebugPanel
{
    public $javascript = [
        '/my_plugin/js/custom_panel.js',
    ];
}Callbacks
Panels have two callbacks that let them inspect the current request:
startup(Controller $controller)is called during the component'sstartup().beforeRender(Controller $controller)is called during the component'sbeforeRender(). Its return value is passed to the panel element as$content, so you do not need to set view variables yourself.
/**
 * Grabs the request parameters.
 *
 * @param \Controller $controller The controller.
 * @return array
 */
public function beforeRender(Controller $controller)
{
    return $controller->request->params;
}Panels can also return a short summary, which is shown next to the panel's button in the toolbar (for example the number of queries of the Sql Log panel):
/**
 * @param mixed $content The content returned by beforeRender().
 * @return string
 */
public function summary($content = null)
{
    return (string)count($content);
}Panel Elements
Each panel has a view element that renders the content returned by the panel. The element name is the underscored class name: SessionPanel uses session_panel.ctp, and SqlLogPanel uses sql_log_panel.ctp. Put the elements in your Elements directory.
The element is rendered at the end of the request, with the view of the request when the page is rendered with the HTML toolbar, and the rendered HTML is stored. The toolbar shows it inside <div class="panel-content" id="<panel>-tab">, where <panel> is the underscored panel name. The toolbar does not include jQuery or any other library, so panel JavaScript must bundle what it needs. Every time a panel has been loaded, an initPanel event is dispatched on document with the panel name prefixed with panel as detail (for example panelmy_custom):
document.addEventListener('initPanel', (event) => {
  if (event.detail !== 'panelmy_custom') {
    return;
  }
  document.querySelectorAll('#my_custom-tab .my-row').forEach((row) => {
    // ...
  });
});<script> elements of the panel content are run when the panel is loaded.
Panels pick up their title and element name by convention. To change them, set these properties:
$title: the title used for the panel's button in the toolbar.$elementName: the element used to render the panel.
Panels in Plugins
Panels provided by a plugin work the same way, but must set $plugin to the plugin name so that their elements can be found:
class MyCustomPanel extends DebugPanel
{
    public $plugin = 'MyPlugin';
}Use plugin dot notation to load a plugin panel:
public $components = [
    'DebugKit.Toolbar' => ['panels' => ['MyPlugin.MyCustom']],
];This loads all default panels and the custom panel from MyPlugin.
Cache Engine
DebugKit uses the File cache engine for its internal caching by default: the legacy toolbar state (ToolbarComponent::loadState(), ToolbarHelper::readCache()) and the request history when the cache storage is used. Use the cache key to use another engine. Any engine supported by Cache::config() works:
public $components = [
    'DebugKit.Toolbar' => [
        'cache' => ['engine' => 'Memcached', 'servers' => ['127.0.0.1:11211']],
    ],
];Upgrading from 2.2.x
2.3.0 replaces the toolbar but keeps the PHP API. Panel classes extending DebugPanel, their elements, the component settings, DebugTimer, DebugMemory, DebugKitDebugger, FireCake and the ToolbarAccess controller keep working. Behaviour changes:
- The toolbar is shown in an iframe in the bottom right-hand corner instead of being rendered into the page, and it is inserted on
Controller.shutdowninstead ofView.afterLayout. Pages rendered without a layout now get the toolbar too, as long as they are HTML and have a</body>tag. HtmlToolbarHelper::send()does nothing anymore; ajax and non HTML requests still use FirePHP (FirePhpToolbarHelper) as before.- The request history is kept in the request history storage (
tmp/debug_kit.sqlite) and is shared by all clients instead of being kept per user agent in the cache. TheHistorypanel content changed accordingly. The legacy cache state is still written,ToolbarComponent::loadState()andToolbarAccessController::history_state()are deprecated. webroot/js/js_debug_toolbar.jsandwebroot/css/debug_toolbar.csswere removed, the toolbar useswebroot/css/style.cssandwebroot/js/main.js. The default values ofToolbarComponent::$javascriptandToolbarComponent::$cssare now empty arrays; they list additional assets loaded into the toolbar iframe.- The toolbar no longer ships jQuery, nor the
DEBUGKITJavaScript API of the 2.x toolbar (DEBUGKIT.module(),DEBUGKIT.loader,DEBUGKIT.$,DEBUGKIT.Util.Cookie, ...). Panelcss/javascriptfiles (DebugPanel::$css,DebugPanel::$javascript) are still loaded into the toolbar iframe, but panel JavaScript must not rely on jQuery or the old API: bundle what it needs and use theinitPanelevent (see Panel Elements) instead ofDEBUGKIT.loader.register(). - The built-in elements no longer print their own
<h2>title, the toolbar shows the panel title. ToolbarHelper::getQueryLogs()no longer clears the query log of the connection.- The
debug_kitconnection is not listed by the Sql Log panel.
Credits
The toolbar look and architecture are ported from cakephp/debug_kit 5.x, Copyright (c) Cake Software Foundation, Inc., MIT License. The copied and adapted files keep the original copyright notice; see NOTICE for the list. The Raleway font is licensed under the SIL Open Font License 1.1 (webroot/css/raleway-OFL.txt).
Toolbar Screenshots (2.3.x)
The toolbar since 2.3.0.
Collapsed: the CakePHP icon in the bottom right-hand corner.

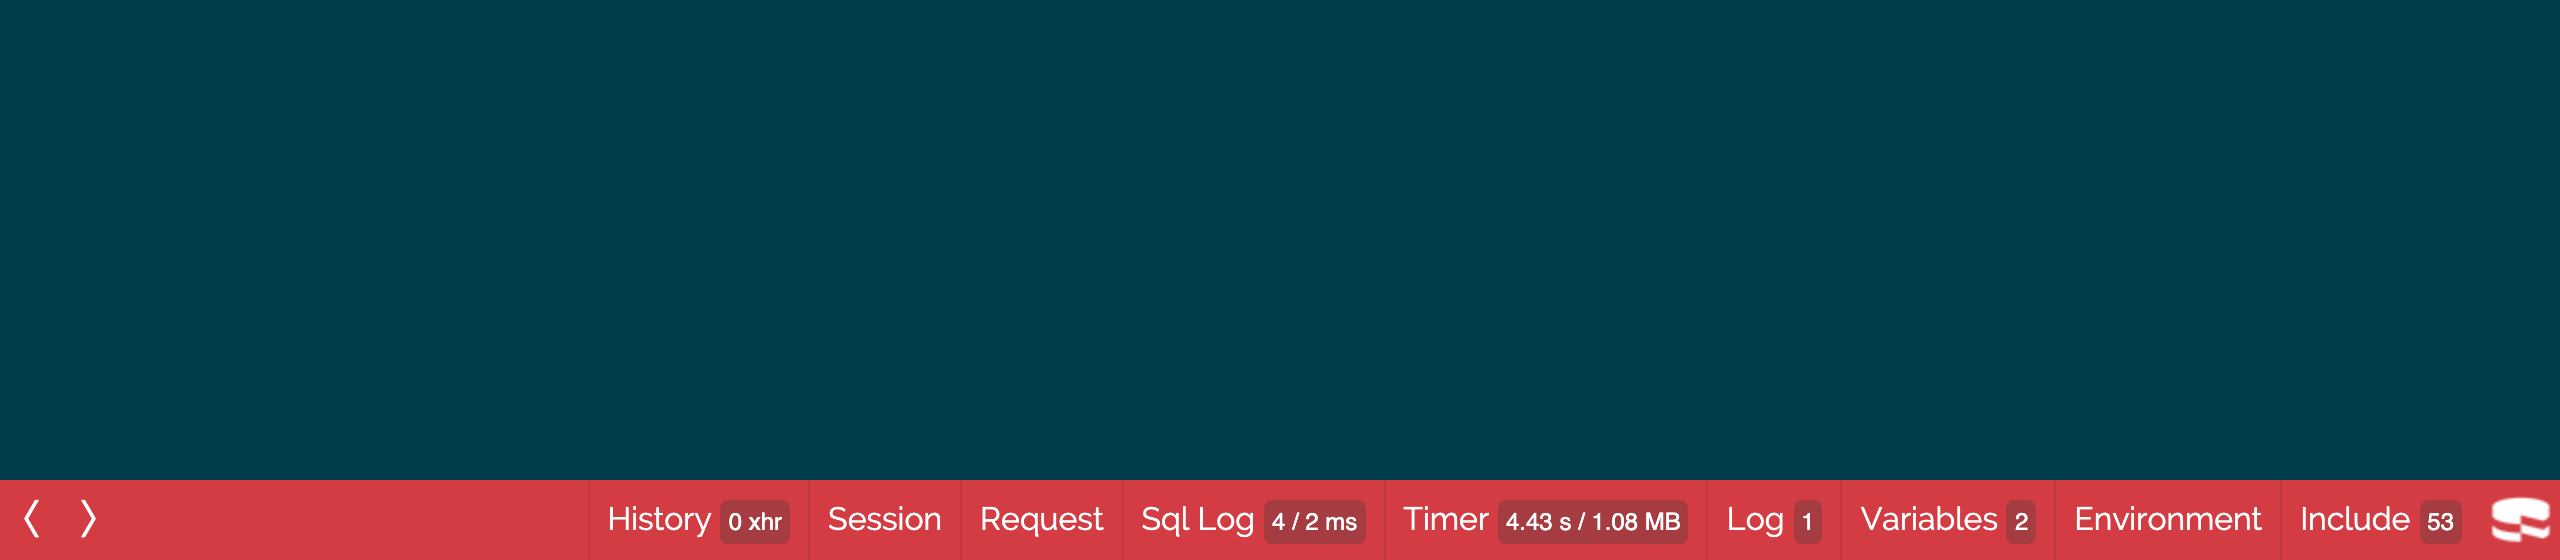
Expanded: one button per panel, with a summary next to some of them.
Request panel:
Sql Log panel:
Timer panel:
History panel, with an ajax request made by the page:
Toolbar Screenshots (2.2.x)
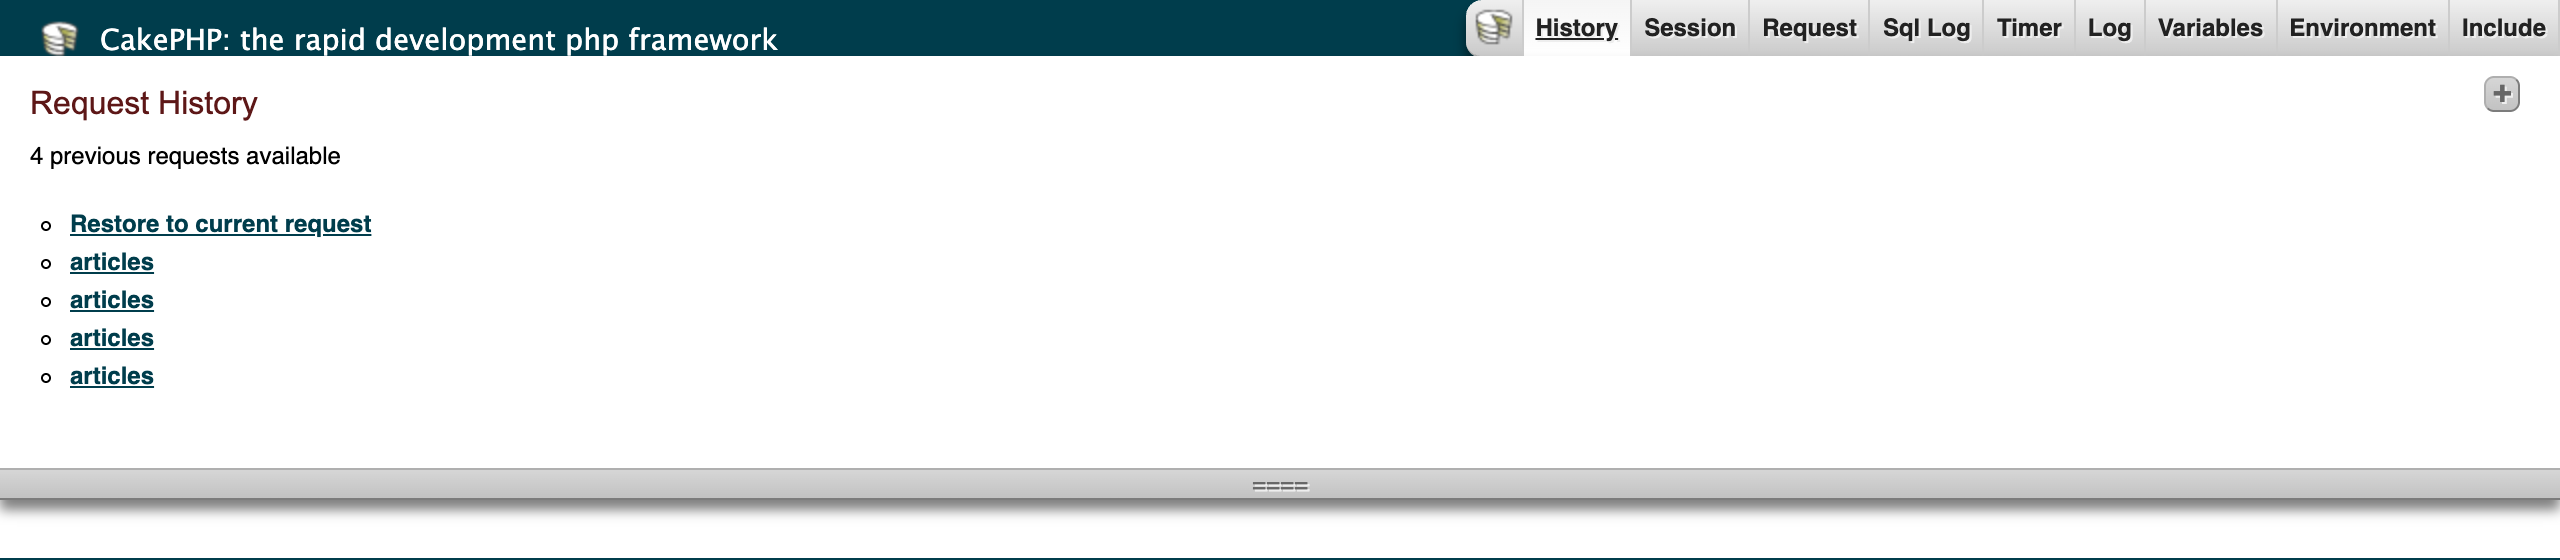
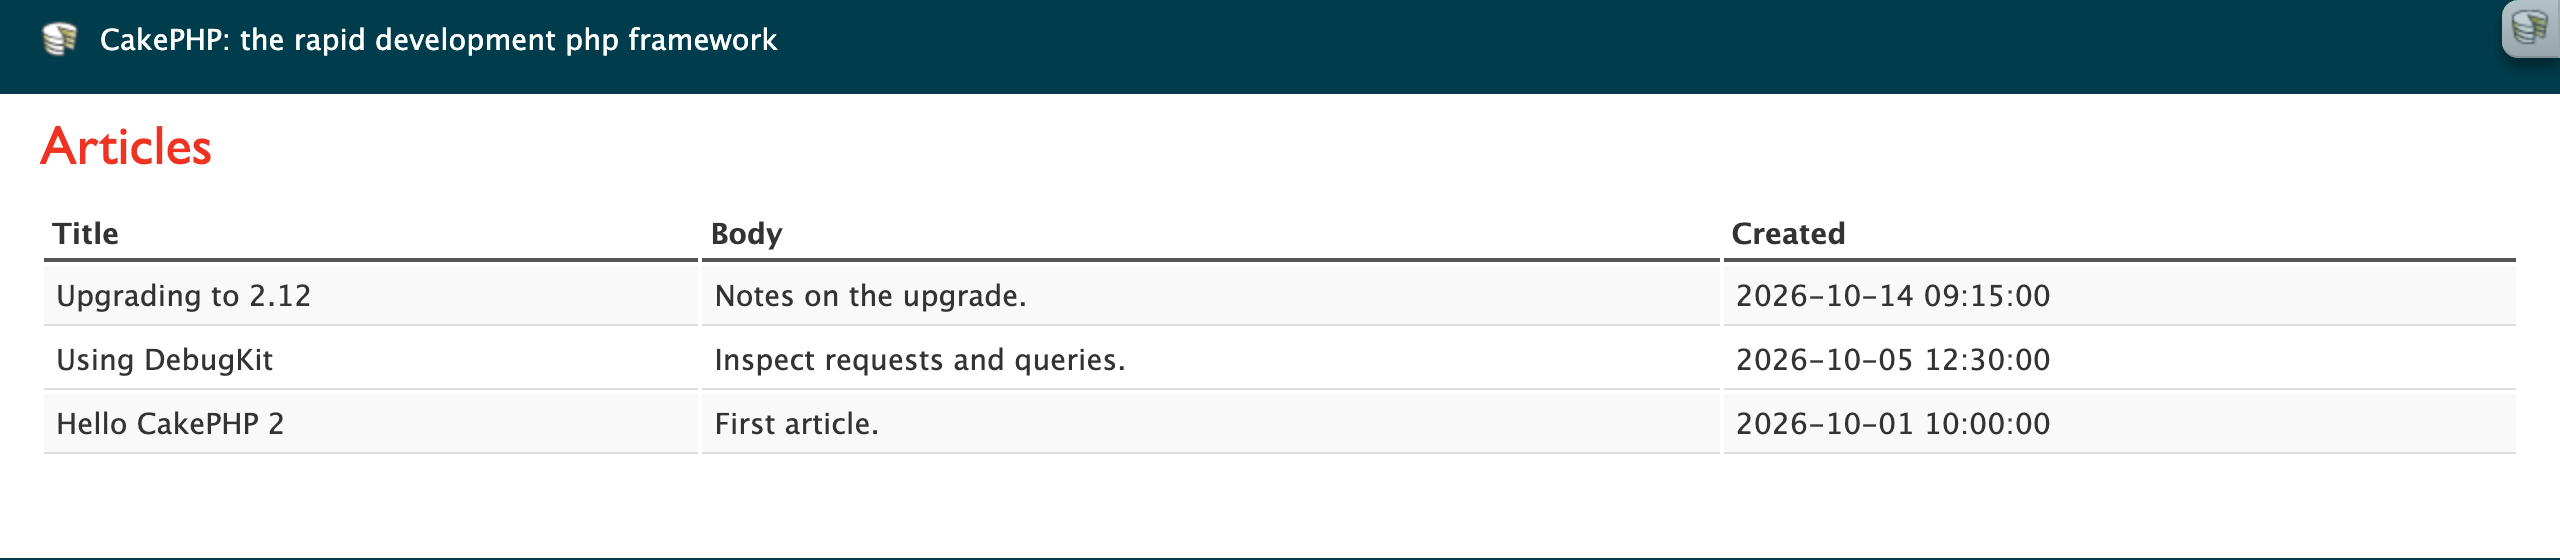
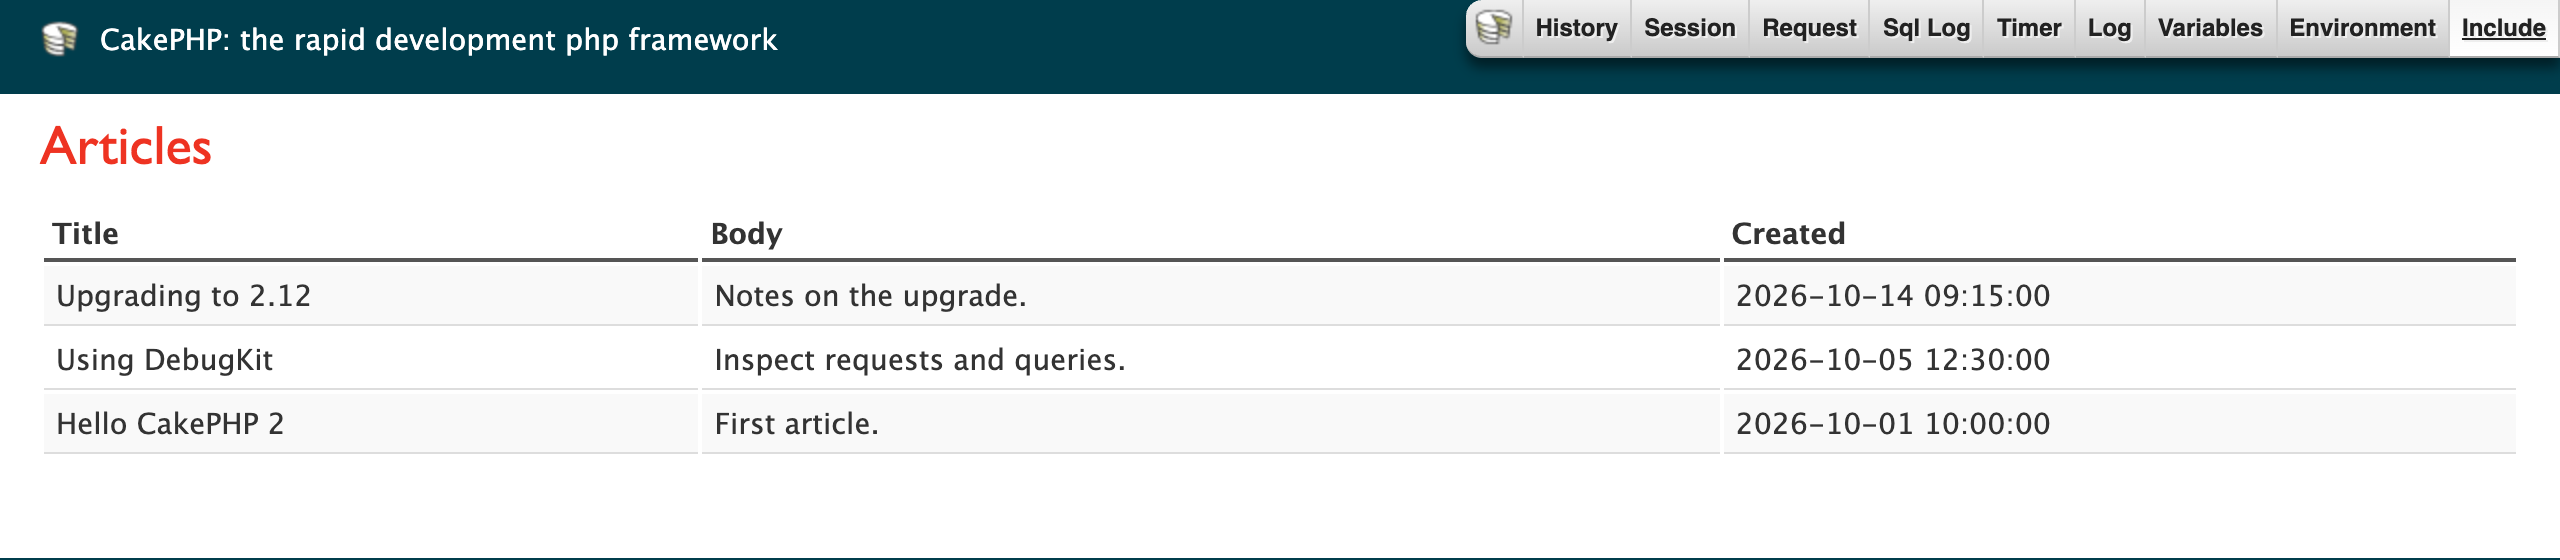
The toolbar as shipped in the 2.2.x releases.
Collapsed: the CakePHP icon in the upper right-hand corner.
Expanded: one button per panel.
Request panel:
Sql Log panel:
Timer panel:
History panel: